Blog Post
In conversation: who are we reaching?
Daniel Cowley at the Audience Agency and Richard Erwin-Jones talk to Eleanor Turney about the audiences Creative People and Places is reaching

As the report exploring audience data for year two of Creative People and Places is published, Eleanor Turney talks to Daniel Cowley of The Audience Agency and National Evaluation Coordinator Richard Erwin-Jones about what the data shows and how it might be used by the wider cultural sector.
You can download the reports and see key findings here
Eleanor Turney: To start us off, can you explain the Mosaic and Audience Spectrum analysis methods?
Daniel Cowley: All the analysis is based on Mosaic and Audience Spectrum, which are geo-demographic profiling tools. Mosaic, typically, is used a lot in the commercial world. If you own a petrol station, for example, and you know where you customers are coming from, you can work out other things about them – and how you might sell them more. We use it in a cultural context, so we’re looking at things like box office records for people who book certain theatre, and then understanding more about their likely characteristics and preferences based on their Mosaic group and type.
Audience Spectrum is a similar idea, but it’s purely arts-focused. It describes people based on their engagement and participation with arts, heritage and culture. From having a list of postcodes of people who have come to an event or participated in some way, we can have a pretty good, informed guess at what their likely overall levels of attendance and participation are. We can also understand other things, like whether they’re more likely to do this sort of thing in family groups or as part of a day out, or whether it’s something they’re likely to do more often or less often. That’s more or less it, as a summary.
ET: Based on the analysis of the data, what are key findings from this report?
Richard Erwin-Jones: One of the major aims of Creative People and Places is to try and engage people in the arts who perhaps haven’t engaged before. So what we need is evidence that the people attending CPP events aren’t the usual arts audiences. That’s why we’ve done this analysis. The headline news is that, of the postcodes we collected, 90% of those people are in the low or medium engagement segments in terms of engaging with the arts. The national population is at 78% so that’s showing that the people we want to attend CPP events are attending. That’s the headline finding, I think. Any you’d like to add, Dan?
DC: That’s the big finding, I agree. What we normally see, for the sorts of events that are put on as part of an arts programme, is an over-representation of the higher-engaged segments, because they tend to do that sort of thing more often. So, the fact that we’re seeing that go the other way, seeing the lower-engaged segments being better represented, speaks quite strongly to those new audiences that are being built by CPP.
RE-J: We also did a new piece of analysis this year around Mosaic and socio-economic groups, and there were some really interesting results in that. Mosaic splits the population into groups – A, B, C1, C2, D and E – and that relates to income and things like that. What we’ve found is that in the lower economic groups, C2, D and E, we got really high indexes, more from those groups than are in the general population. So that really shows that CPP is reaching those people, who perhaps haven’t engaged in the arts previously.
DC: We would expect to see an over-representation of the A, B and C1 groups, partly because those people have got more economic choice about what they do, and because the areas where people who are more likely to fall into A or B groups live are also more likely to have lots of arts provision. It shows that by putting stuff on in areas that have more people in the lower engaged segments or in the C2, D, E groups, you can attract people who are traditionally less engaged with the arts.
ET: You’re looking at what could potentially be a vicious circle – low arts engagement and low income can be linked, because most arts activities and events cost money. I’m assuming that it’s more nuanced than that. It seems from the reports that CPP projects are reaching audiences that other projects don’t, but it’s not just a sense of “put on an event and people will come”. Does the data show what these nuances might be? Can we unpick how CPP is reaching people that other projects might not?
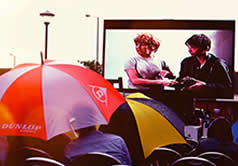
DC: We can certainly do that. If we look at the benchmarks for arts audiences generally, you can definitely see that CPP events have larger proportions of the lower-engaged segments. So that’s really key – reaching different audiences from the average arts event. We did some analysis for the Year 2 data, which looked at different sorts of events to see how the profiles differed for different events. We looked at whether there was a cost. Across all of the events that we analysed, there were 292,843 people at the free events, and 28,869 at paid-for events, so around 90% of the people who engaged with the CPP programme in Year 2 did so at free events. However, although free events attracted a larger proportion of people from the lower-engaged segments than the paid-for events, it wasn’t a huge difference; 52% of the audience at free events were in the lower-engaged segments, compared to 49% at the paid-for events. To me, that suggests that it’s not all about making it free to attract people from the lower engaged segments. It’s not as simple as “make it free and people will come”.
RE-J: It’s also really, really important, in terms of developing sustainability in the programme. Initially, lots of CPP activities were free, but as we’re looking to sustain the programme, we need to be able to balance free events with events that have a small charge. This data shows that entry cost is not a massive barrier, which we were a bit concerned that it might be. We’ve now got the data to show that we can actually charge a small fee and not see audiences drop off, which is really encouraging.
DC: Yeah, the profiles are remarkably similar between costed and free events, so that’s a really useful finding for planning going forward.
ET: In terms of the free vs paid events, we’ve talked about the fact that the audience profiles for paid-for events were similar enough to free events that charging for events need not be seen as a problem. I wonder if there’s something in the data about the journey that audiences went on – i.e. are the people who paid for events those who attended a free event and enjoyed it, or are they totally new audiences? What does the data show about repeat visitors to paid-for events?
DC: This isn’t something the data can tell us directly (we don’t know whether people in the sample had been to similar events in the past, free or otherwise), but there might be something from other surveys carried out at individual places or for the meta-evaluation which could shine a light on this.
ET: Thanks. Were there significant differences in this year’s data compared to last?
DC: That’s a really good question! We haven’t actually formally done a year-on-year comparison yet. That’s to come after this report; we’ll be doing a bit of trend analysis to see if things are moving in one direction or another.
RE-J: Broadly, the results are similar, which is encouraging. We attracted a similar demographic in the first and second years. We were particularly concerned because there were more paid-for events in the second year, and the fact that the demographics haven’t dramatically shifted is really encouraging. When this report is published, we’ll start to look at trends. You can’t really look at trends from just two years.
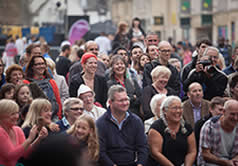
ET: In terms of who is attending, it seems that the percentage of local people is very high. Does the data show that it’s not just the local area’s regular arts attenders who are attending, or people from other places coming in, but it really is people who are traditionally low attenders starting to attend?
RE-J: Oh, absolutely! Although CPP programmes are specifically held in areas of low engagement, we were worried that those events might get flooded by the regular arts audiences, especially the free events. But we’re finding that they’re emphatically not. We’re getting local people and people who haven’t particularly attended arts activities in the past. The data really backs that up.
DC: Yeah, we definitely see that. So, across the whole CPP project, 77% of participants are local – defined by being within the scope of each project area, which can be relatively small geographic areas. Pretty much all places are achieving at least three-quarters, and many are achieving as much as 90%, so definitely the local focus comes through.
ET: This is slightly less of a data question, but might be interesting nonetheless. If we take something like A Night Less Ordinary [the Arts Council England scheme that gave away theatre tickets to under-25s], there was a worry that it would mean that people who would normally have paid would get a free ticket instead. This seems like the inverse of that! I wonder what it is about the CPP process, mentality or strategy that is so successful?
RE-J: The CPP areas generally have fairly low arts provision – fewer Arts Council funded arts organisations etc. So we’re not taking audiences from elsewhere, we’re getting new audiences. Some places have done some analysis where they asked people what they would be doing if they weren’t at this event, and they mostly aren’t saying they’d have gone to the theatre or whatever. These are new activities and I think that’s important. What’s been key is that a large proportion of these events don’t take place in existing arts buildings.
DC: I’d absolutely agree with that. The idea of building an infrastructure where there hasn’t been so much of one before, has been a pretty consistent theme across the projects. Not necessarily in terms of buildings, but in terms of people and networks. Some of the projects are about using existing infrastructure and encouraging new people to go to and engage with things they may not have already been aware of.
RE-J: Yes, it’s always been the thing – getting new audiences to cross the threshold into a building. People feel that it’s not for them. What CPP is trying to do is take arts activity to local places, unusual places, new places, so that people find them in their everyday lives. They’re not having to travel to an arts building to experience high-quality arts.
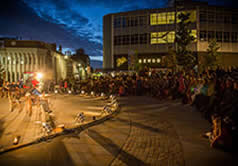
DC: We see that in the analysis as well. We had a look at the kind of audiences you get based on the type of location the event is in. We found that indoor arts venues attracted the highest proportion of the most engaged, and the lowest proportion of the least engaged. When we go through to outdoor venues, we see the highest proportion of the least engaged. So it definitely looks like there is some interaction between the segment that people belong to and their likely level of engagement, and how likely they are to step through the door of an existing arts venue. Those barriers are lowered in locations that aren’t seen as typical arts or cultural institutions.
RE-J: One of the key pieces of analysis that places are doing locally, is that they’re asking people whether the event they attended is something they would like to do again in the future. So what we’re hoping is that by introducing the arts in a familiar environment, it makes people more like to seek art in those buildings and to step over that threshold.
ET: CPP projects engage with local people in many different ways – e.g. co-commissions, involving people in choosing, creating and presenting work. This is obviously key to CPP’s success but I wonder if there’s anything explicit in the data showing why this approach is important and which approaches work best for different segments?
DC: We didn’t collect information on which events were co-commissioned or co-created, but we do know which events had participatory elements. What we can see is that these events were more effective at attracting those from the lower engagement segments – 64% of the audience for these events were from one of the lower engagement segments, compared with 56% at events with little or no participatory elements.
RE-J: Just to follow on from Daniel’s comments, with regard to CPP projects engaging with local people, we have just commissioned a piece of research from Thinking Practice working in partnership with Consilium looking at excellence of both the art and the process of engagement. Understanding how CPP engages with local people is a key to the evaluation and we’ll be following this up with a number of case studies and a further detailed piece of research addressing this very question.
ET: We’ve talked about price and location, but what other variables are affecting attendance?
DC: There’s a whole bunch of different variables. We looked at the time that the event takes place – morning, afternoon, evening. We looked at whether there’s an active participatory element or not. We also looked at geography, too – whether an event was taking place in an urban area or a fringe area or a rural area. We had a look at whether events were on weekends or weekdays. We looked at the size of the events, too – were very small events better at attracting certain segments, for example. Finally, we did some analysis by art form – were there certain art forms that seemed to be particularly affective at attracting particular segments of people.
The report goes into quite a lot of detail about different types of events and pulls out the differences. So, for instance, we looked at to what extent people who live in urban areas go to events in urban areas or in rural areas, and vice versa. There are lots of findings in there which will have implications or insights for the sector, and there’s other stuff that might not be as widely useful but will be really useful for individual CPP places and projects.
There are also things that will be useful for arts practitioners who want to know what the impact is of doing an event in one place instead of another, or what sort of audience they might reach if they have an event in the afternoon instead of the evening, or have a combined arts event instead of a dance event. Hopefully it will give an idea of what the different preferences are in different segments, for events at quite a specific level.
RE-J: We think this is useful information to share with the sector so people can get an understanding of how different events and timings etc affect the make-up of the audience.. There’s probably some further analysis to be done to see how that can reflect on areas with an existing arts audience.
ET: If you were to offer tips of advice to people programming or marketing CPP events, are there things that the data shows would be useful?
DC: I would say – and this might be a fairly boring answer! – but if you’re coming from a starting point of “we want to programme a particular type of event”, or “we know where and when we want to put an event on”, this data will be really helpful to give you a sense of who is likely to come, and therefore how you could talk about this event and how you could market it. And then on the flip-side, if you’re starting from the position of “we want to do something that will engage with this particular segment”, then you can take it from that side and see what preferences that segment has. So, I think using it in both those ways to help plan and work out how to reach people, will help people to have a successful event. It’s potentially really useful for that.
RE-J: What we found, whether you’re looking at time of day or art form or whether you charge, is that as long as you put a high quality event on, you are broadly attracting a similar audience. Some of the expected barriers perhaps aren’t as big as expected – you can charge for certain events and still get a wide cross-section of audience. Because CPP places have experimented with lots of different types of events, it shows that across those events you’re still getting a balanced audience which is great!
ET: To wrap up, then, any final points you’d like to raise?
DC: We’re interested in what CPP places and other practitioners can achieve and how they can use this data. We’re continuing to use these techniques to understand who is participating and to start understanding why, too. It’s super interesting! This all also needs to be seen in the context of other evaluation work that’s being done, at a local and a national level. Putting those alongside this data should give a really specific, local insight into what’s working and going well, and how that chimes with this simple but powerful national analysis.
RE-J: I’d finish by saying that arts funding in the past has been criticised as being for the few, but I think the evidence we have shows that CPP really is reaching a broad cross-section of society, not just the people who have historically been arts attenders.
DC: And in good numbers, too! Last year we had getting on for half a million participants, so the size is there as well as the breadth.
ET: Thank you both very much.
Filter by
DATE
- August 2019 (1)
- July 2019 (1)
- May 2019 (2)
- March 2019 (1)
- January 2019 (1)
- December 2018 (1)
- November 2018 (1)
- August 2018 (3)
- July 2018 (5)
- June 2018 (3)
- May 2018 (1)
- February 2018 (1)
- January 2018 (1)
- December 2017 (1)
- October 2017 (1)
- September 2017 (7)
- August 2017 (1)
- July 2017 (1)
- May 2017 (1)
- April 2017 (1)
- February 2017 (1)
- January 2017 (2)
- December 2016 (6)
- November 2016 (2)
- October 2016 (6)
- August 2016 (3)
- July 2016 (1)
- June 2016 (2)
- May 2016 (1)
- April 2016 (1)
- January 2016 (1)
- December 2015 (4)
- November 2015 (1)
- October 2015 (2)
- July 2015 (3)
TAGS
- - No value - (1)
- 64 million artists (1)
- action learning (2)
- action research (1)
- apprentices (1)
- apprenticeships (1)
- artist (1)
- artists (2)
- arts engagement (1)
- Arts Marketing Association (1)
- audience (1)
- Audience Agency (1)
- audience data (1)
- audience development (3)
- audience engagement (1)
- Audience insight (1)
- Audience Spectrum (2)
- Australia (1)
- brass bands (1)
- building whilst flying (1)
- class (1)
- co-commissioning (1)
- collaboration (1)
- commissioning (3)
- communications (1)
- community (1)
- community commissioning (1)
- community engagement (14)
- conference (17)
- consortium (1)
- creativity (1)
- critical friend (1)
- cultural connectors (1)
- culture (1)
- digital (2)
- disability (1)
- diversity (3)
- eco-systems (1)
- engagement (19)
- evaluation (10)
- everyday artists (1)
- excellence (2)
- First Art (1)
- funding (3)
- governance (1)
- health (1)
- health and well-being (1)
- impact (1)
- inclusive (1)
- infrastructure (1)
- international (1)
- leadership (4)
- learning (14)
- live stream (1)
- making (1)
- meta evaluation (1)
- national evaluation (1)
- network (1)
- No Boundaries (1)
- opportunities (1)
- outdoor arts (1)
- participation (3)
- participatory decision making (2)
- partnership (1)
- partnerships (7)
- peer learning (3)
- people (1)
- people place power (3)
- place (1)
- portraits (1)
- post-industrial (1)
- postcode analysis (1)
- power (2)
- reach (1)
- research (8)
- rural (1)
- segmentation (1)
- shared decision-making (3)
- sharing learning (1)
- skills (1)
- social capital (1)
- social change (1)
- social media (2)
- stewards (1)
- Sweden (1)
- top tips (1)
- training (1)
- Voluntary Arts (1)
- voluntary sector (1)
- volunteering (1)
- wellbeing (1)